It has never been easier to see how well your marketing investment is performing in clicks, likes, sentiment, web visits, phone calls, applications, sales, and profit. But in too many cases, marketers focus on easily measurable metrics that give an alarmingly short-term view.
To counter this, we conducted a study which looked at the long-term impact of marketing across seven categories and 29 brands. The aim of this research was to show:
- how marketing impacts business revenue and profit in the long term
- how marketers can make the right decisions to drive long-term growth.
Our research found that digital attribution measured only 18% of the long-term impact of marketing on sales. Econometric techniques bridge the gap, but only get us 42% of the way there. It is only by looking at marketing through a more long-term lens that we can truly understand the full impact.

How to understand and measure long-term impact
We set out to measure and understand the long-term multiplier (LTM) to short-term impact. By way of example, let’s consider a brand that ran a £5m TV campaign. Econometric analysis could measure its short-term impact at £10m in value sales, giving us a short-term ROI of £2 (£10m value sales divided by £5m spend). In contrast, the LTM tells us how much this impact grows over the long term. If we measured a LTM of 3x, then this would be because the long-term impact of the campaign was £30m. It’s important to note that the £30m includes the initial £10m short-term impact. The overall long-term ROI is £6 (short-term ROI of £2 multiplied by 3).
The LTM is measured by analysing the base – the level of sales return in the long-term if a brand ran no marketing, which can be seen as a measure of a combination of mental and physical availability, or brand strength. Standard econometric practise is to use a flat base, which does not move over time. However, one of marketing’s functions is to change tastes and preferences in the long term. So, if we allow the base to change in the long term, we can reflect these long-term movements in tastes and preferences. And if we can understand how marketing impacts the base then we can show how many long-term sales were driven by marketing, giving us the LTM.
Let’s look at five key results from the study.
1. TV has the greatest LTM of all media channels
Across all categories, TV has an average LTM of 2.35. The only other channel with an LTM over 2 is Out of Home (OOH):

This persists across categories:
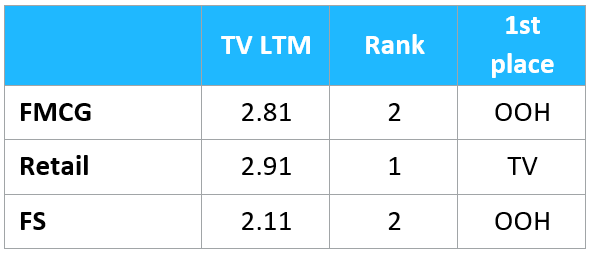
TV also has the highest efficacy, with its 25% point (the point at which 25% of LTMs are higher, and 75% are lower) being higher than all other media at 3.87.
2. Activation and direct response media can drive short-term ROI but lack long-term impact
The LTM for search, display, and radio are at the lower end of the spectrum, which is an important insight for both CMOs and CFOs. If certain media are driving high short-term returns but have a limited long-term impact, it’s likely that a brand is missing out on significant potential long-term revenue drivers, potentially causing harm to the business.
3. Brand media investment drives LTM
The strongest drivers of LTM are levels of brand media investment and the number of bursts of activity. Where we have seen brands invest in media, such as TV, VOD, print, and OOH, at a level which is over and above their competitive set, we have seen higher LTMs than where investment has been under that seen in the competitive set.

Additionally, there are benefits to persisting with a campaign. The LTM from running three bursts is double that of a campaign which only has one burst of activity.

4. The factors that indicate long-term effect
The greatest indicator of long-term effect from media is the level of base sales. However, this can take time to observe as base shifts are measured in months and years, and often require advanced statistical techniques.
In lieu of a base modelling approach, long-term effect becomes apparent and can be observed in the impact on brand equity metrics, price elasticity, and activation metrics.
i) Brand metrics
Brand metrics often give a guide to long-term brand strength. While the choice of brand metrics can be overwhelming, with many advertisers running surveys with hundreds of questions, it is normally a small range of metrics which provide this guide. In 65% of cases, consideration forms the closest link to base sales, where growth in consideration causes growth in the base. The level of impact form consideration differs from industry to industry and brand to brand, but a guide is that a 1%pt increase in consideration can be expected to drive a 0.5 – 2% increase in base sales.
A slightly more advanced method is to observe a small basket of metrics, generally comprising awareness, consideration, and those brand metrics which have a close link to base sales. These will differ by brand and industry, but commonly include value for money, trust, and service. Tracking a basket can give a business a ‘campfire’ number – one that is easy to track and observe whilst indicating long-term success. For a number of large advertisers, while growth in brand metrics is always welcomed, a lot of advertising spend is aimed at maintaining the brand, the base sales, and ultimately the business.
ii) Price elasticity
Another way in which long-term health can be measured is by analysing price elasticity over time. The theory is that consumers will overlook price differences for a brand which they believe is higher quality, or a brand in which they have more trust.
For one of our FMCG clients, price elasticity went from -1 (a 10% rise in price causes a 10% drop in units sold) to -0.4 (a 10% rise in price causes a 4% drop in units sold). This happened over a three-year period in which the brand went from minimal brand advertising to a relatively consistent presence on TV and VOD.
It takes a significant amount of spend to shift price sensitivity, and this level of spend will depend on the category, the brand, the competition levels, and the quality of product. As a rule of thumb, share of voice (SOV) is the best metric to consider – for every 10%pt of SOV increased, we can expect a between 5%pt -20%pt reduction in price elasticity. However, there are diminishing returns to scale – if SOV is already at 50% there is a minimal impact of increasing to 55%, for example.
5. If brand investment stops, things can go wrong very quickly
It is rare for brands to stop investing in brand media to save money, but there are lessons to be learned from those that do. Here are three examples:
i) The retail bank that stopped TV advertising
A retail bank had been advertising on TV and VOD consistently for two and a half years. However, they decided to stop and went dark for two years. There was an immediate short-term impact as sales caused by TV dropped. But the long-term base impact was stark. Over two years their base dropped from 20,000 quotes a month to 11,000. They were still able to generate quotes using other channels, but their efficiency reduced – a generic paid search cost per quote increased by 20%, for example.
ii) The financial services business that stopped and started TV advertising
Another financial services brand that had been advertising on TV and VOD consistently also decided to stop. They started advertising again after two years and the short-term results were good – they saw the same cost per application and the same % uplift from TV. However, their base had halved and it took three years to rebuild their base to pre-dark levels, using a continuous level of brand media to do so.
iii) The travel brand that went off-air to protect profit
A US-based travel brand took $3.4m out of its TV budget to save money. They lost 41,200 transactions in the short term, equivalent to $3m of profit, so the net impact was $0.4m profit added to the bottom line. However, the brand did not account for the long-term impact of its decision. Taking base deterioration into account, the total long-term transaction loss was 81,600, equating to a $4.5m loss in profit. The net loss from going off TV was -$1.1m.
Take the long-term view
Brand advertising can have a significant long-term impact, which is often missed when there’s a short-term approach to marketing measurement. There are ways to understand the long-term impact, either by modelling, or by analysing brand metrics, price sensitivity, or activation media.
Our analysis shows that the media channels which drive long-term impact are those which have the time and space to tell a story and to embed themselves in consumers’ minds. As a result, TV is likely to be the best channel to drive long-term impact and, alongside it, business success.
In a world of multiple metrics and vast amounts of data it can be easy to focus on the short term and easy-to-measure metrics. However, this does the whole industry a disservice. We encourage all advertisers to take a longer view to demonstrate the full impact of marketing.